Case Studies of BI Tool Operations: Creating a Chart Board from Excel
Easily create chart boards using the BI tool 'MotionBoard'.
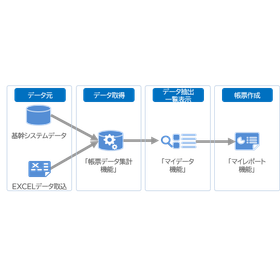
"Motionboard" excels in data representation and visualization, allowing you to consolidate scattered data into one place and create original boards and graphs. A wide variety of charts suitable for different purposes are available, enabling you to view data from diverse perspectives. Additionally, with forecasting and analytical functions, it is possible to formulate hypotheses and explore issues. 【Features】 ■ Integrates various data sources for centralized management ■ Operable with GUI only, no specialized knowledge required ■ Easy to start and expandable 【Examples】 ■ Sales aggregation analysis ■ Created from sample data in Excel ■ Abundant chart types *For more details, please refer to the PDF materials or feel free to contact us.
- Company:ウェーブフロント 本社
- Price:Other


![[Data] Complete Guide to Choosing BI Tools from the Perspective of System Administrators](https://image.www.ipros.com/public/product/image/0bc/2000644509/IPROS52338093963851722895.png?w=280&h=280)


![[Case Study on Solving Challenges in Smart Factory Construction] Data Visualization and Analysis](https://image.www.ipros.com/public/product/image/4e2/2000615227/IPROS37071767782348103966.png?w=280&h=280)
![[Data] Introduction to Data Utilization for Manufacturing DX](https://image.www.ipros.com/public/product/image/192/2000910440/IPROS27784049882361214644.png?w=280&h=280)


